We have been consistently delivering sustainable financial
performance, creating value for all our stakeholders.
Revenue (` in mn)
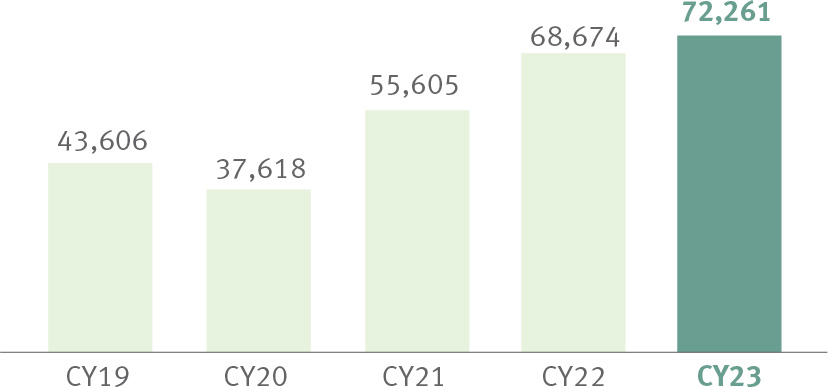
Our revenue for CY23 was 5.2% higher compared to the revenue from the previous year; domestic business grew by 9.2%. The automotive business registered strong growth though the industrial business slowed down slightly while exports lagged due to external economic headwinds.
EBIT* (` in mn)
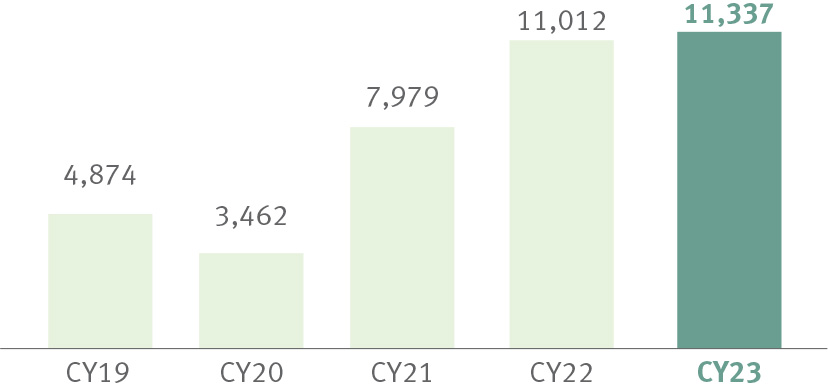
EBIT went up 2.9% from CY22 to CY23 following sustained quality of earnings due to efficient utilisation of resources and productivity measures.
* Earnings Before Interest & Tax (before exceptional item),
PAT and net margin (` in mn/%)
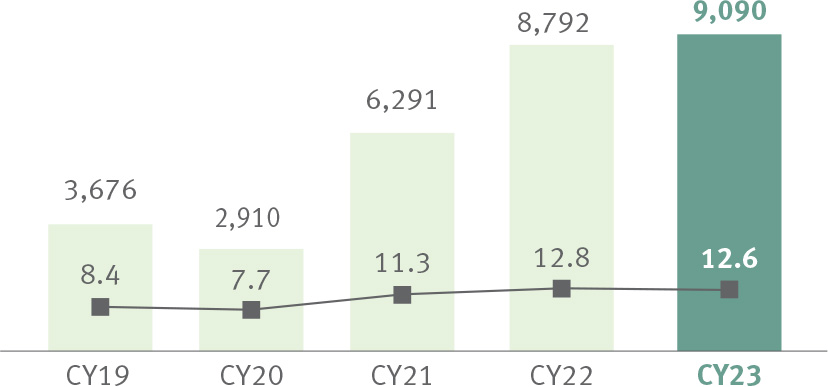
Our PAT for the year stood at H9,090 crore, up 3.4%, while PAT margins reduced marginally due to adverse sales mix.
EPS (`)
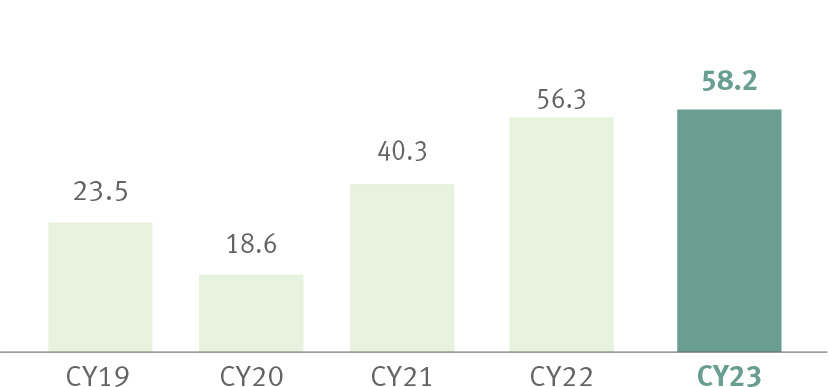
In line with PAT, EPS was up marginally over the previous year.
Free Cash Flow (FCF)1 (` in mn)
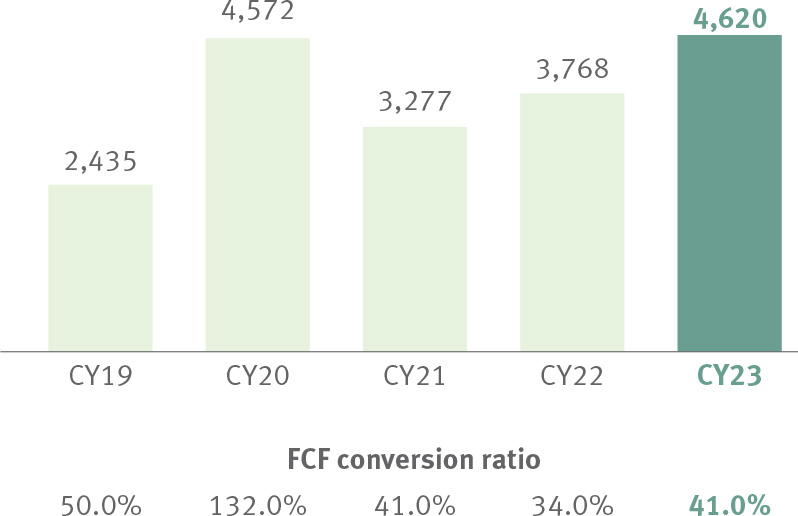
We continued our endeavours to optimise working capital management, utilisation of plant capacities, and capital expenditure practices, which resulted in a healthy Free Cash Flow (before cash in and outflows for M&A activities) of `4,620 million during CY23, up by 22.6% as compared to the previous year.
1 Before cash in and outflows for M&A activities
Capex1 (` in mn)
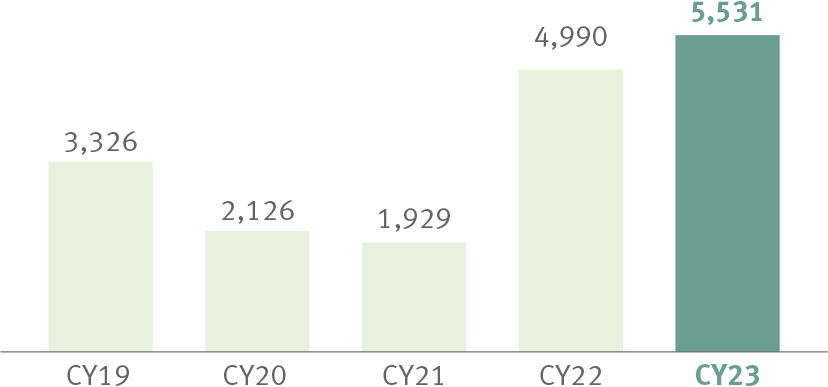
As part of our commitment to expanding our business, we invested `5,531 million in Capex, up from `4,990 million in the previous year. Although this year saw slightly slower growth, we continued our expansion plans focusing on mid-to long-term growth potential.
1 Capex Gross
Dividend per share (`)
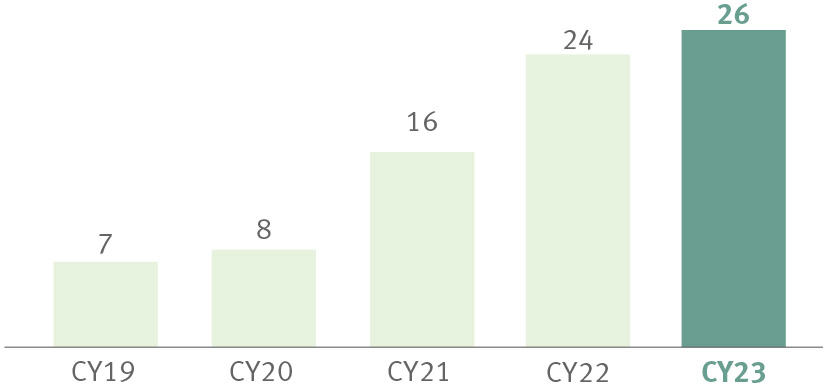
Dividend per share restated due to sub division of equity share
from `10 to `2 per equity share.
We remained focused on maximising shareholder value during CY23 and achieved a dividend payout of `26 per equity share (with a face value of `2).
1 5-year CAGR
Dividend payout ratio (%)
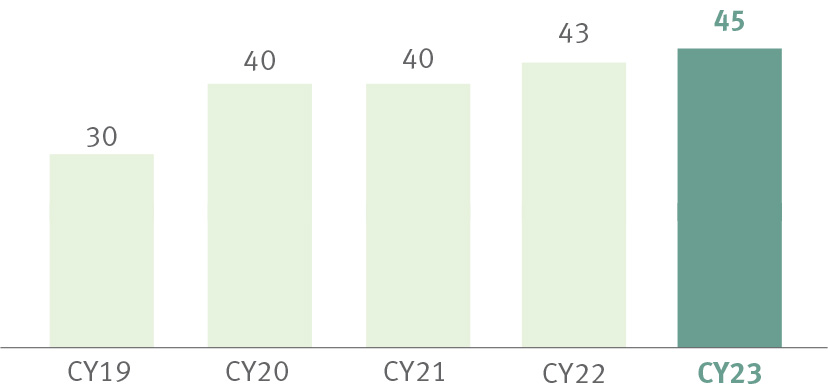
This year’s dividend payout ratio stands at 45%. This ratio has been gradually increasing and is in line with our target dividend payout range of 30-50% of the annual standalone PAT.
![]() y-o-y growth
y-o-y growth