While leading the charge with innovative mobility solutions, we are steadfast in our commitment to enhancing shareholder returns. By fostering regular stakeholder engagement and delivering transparent disclosures, we reaffirm our dedication to sustainable value creation.
Effective stakeholder engagement
Schaeffler India focuses on understanding factors affecting investor opinion. This ensures the Company’s long-term success and enables it to maximise value creation for shareholders. The organization is working towards actively fostering engagement with all stakeholders throughout the year, ensuring meaningful connections and collaborative growth.
` 62.6
EPS
Dividend Payout Ratio (%)
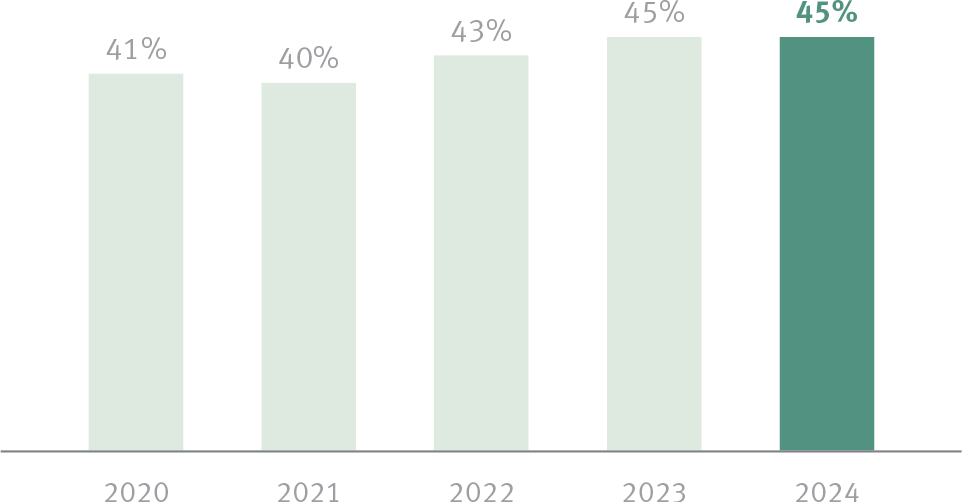 Target dividend payout ratio, 30% to 50% of net income
We have delivered sustained
growth
and profitability during 2024.
11.8%
Growth in revenue
10.7 %
Growth in EBITDA
23.8%
RoCE
8.6%
Capex as % to sales
India’s top 500 Value Creators for 2024
Adding another feather to our cap, Schaeffler India
Limited has been recognised by Dun & Bradstreet
as one of India’s Top 500 Value Creators for 2024,
securing the number one position in the bearings
category. This prestigious accolade celebrates our
commitment to creating sustained value for
stakeholders, extending beyond financial growth.
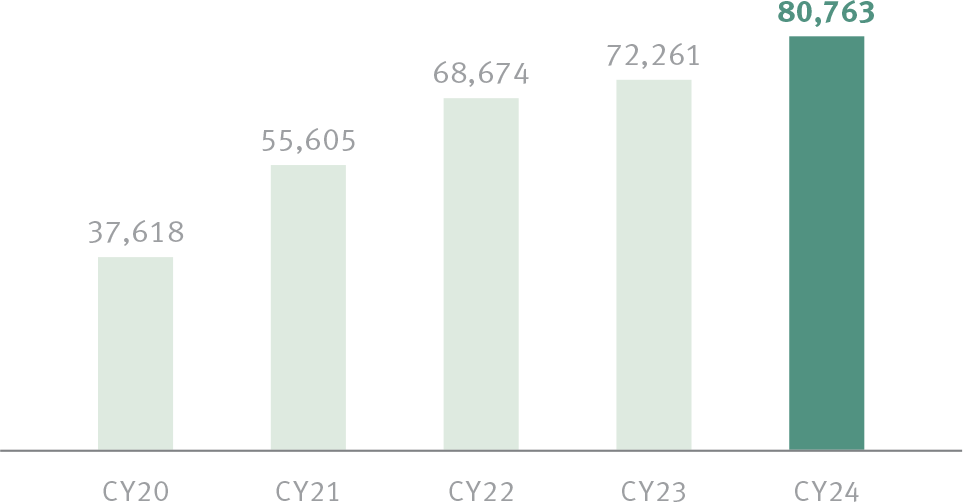
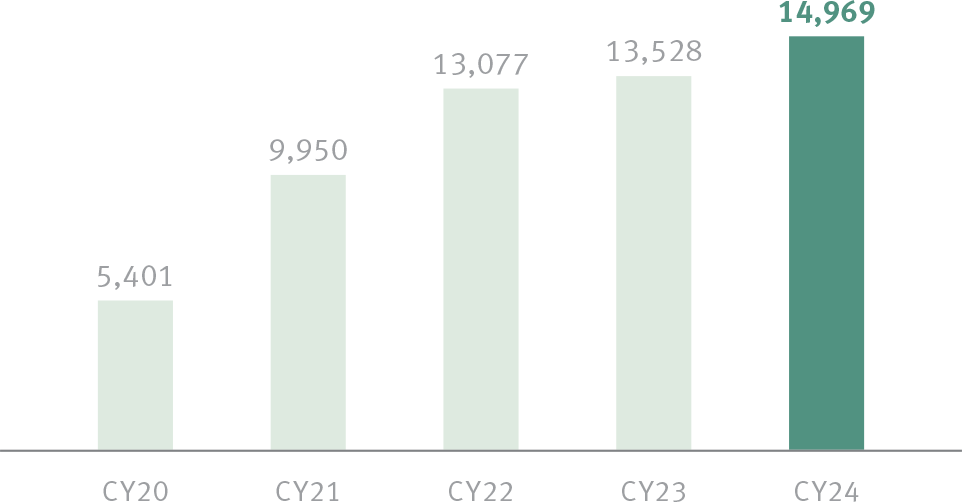
Revenue (` mn)
CAGR (5 year): 16.5%
Our revenue for CY24 was 11.8% higher compared to the revenue from the previous year. This was aided by our focus on new business wins and excellence in quality and delivery.
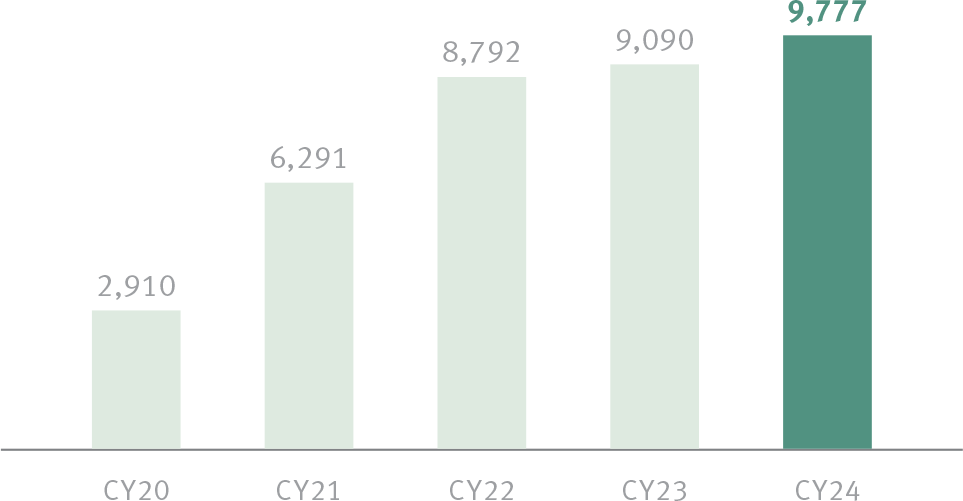
EBITDA (` mn)
CAGR (5 year): 22.6%
EBITDA went up 10.7% from CY23 to CY24 following sustained quality of earnings due to efficient utilization of resources and focus on prudent financial management.
PAT (` mn)
CAGR (5 year): 27.4%
Our PAT for the year stood at ` 9,777 million, up 7.6% YoY, while PAT margin was 12.1%.
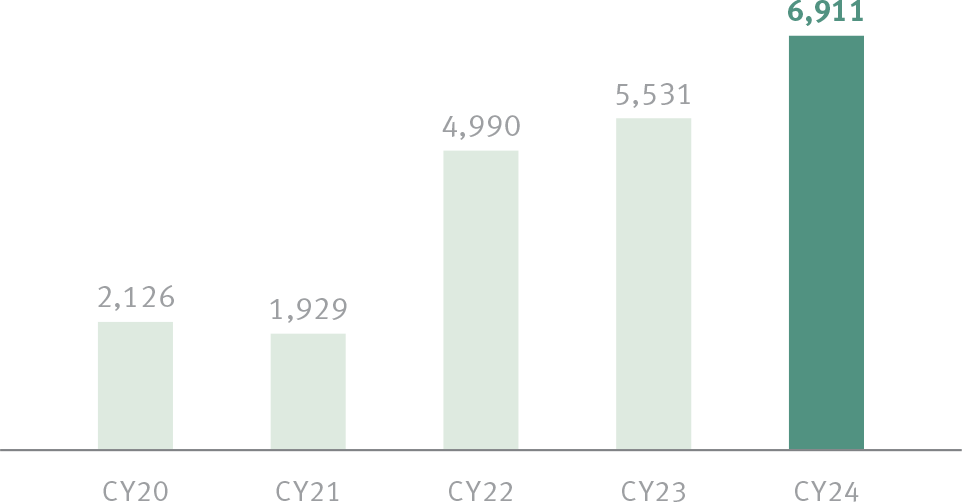
Capex (` mn)
CAGR (5 year): 25.5%
As part of our commitment to expanding our business, we invested ` 7,405 million in Capex. We continued our investment plans focusing on mid- to long-term growth potential.
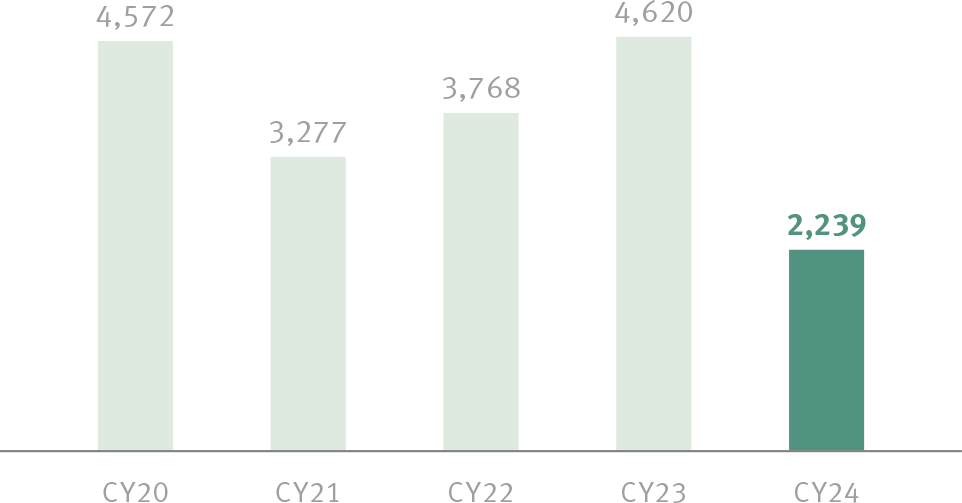
Free Cash Flow (` mn)
CAGR (5 year): -13.3%
We continued efforts to optimise working capital management, utilization of plant capacities and capital expenditure practices, which resulted in a Free Cash Flow of ` 2,239 million.
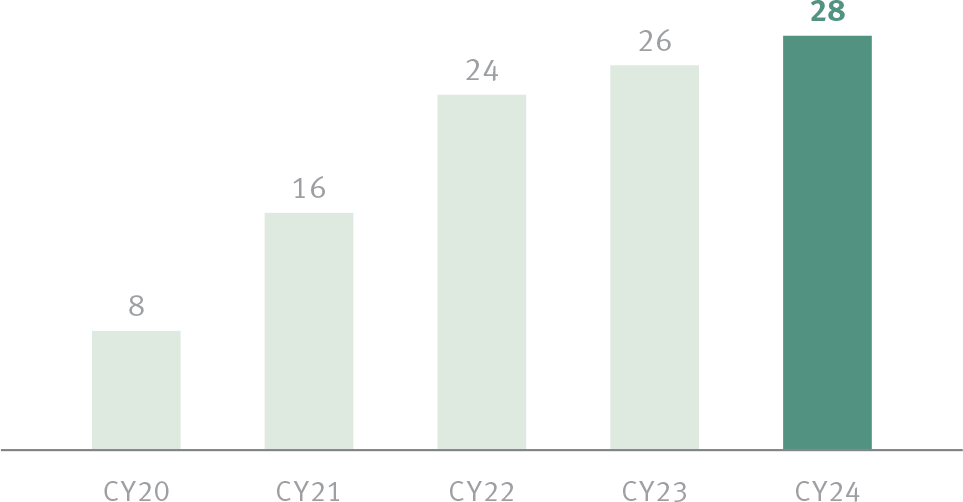
Dividend per share(`)
CAGR (5 year): 29.8%
We remained focused on maximising shareholder value during CY24 and achieved a dividend payout of ` 28 per equity share (with a face value of ` 2). Our dividend payout ratio stood at 45%.